
New Pew Research Center data suggests if we keep on the current track of our generational habits, race might just become a blur of the past
By Curt Cramer

The Pew Research Center released a new book in March authored by Paul Taylor, The Next America: Boomers, Millennials, and the Looming Generational Showdown, speaking on the rapidly changing American demographic that we’re currently embarking on, which includes several fascinating facts about what Americans will be like over the next 50 years.
Public opinion surveys and demographic data compiled by Pew showed some peculiar trends never before seen in history.
Average living age range instead of representing a historically typical “pyramid” shape – with most living people being in the middle ages – will become “rectangular”, boasting just as many 85+ year olds as in the 0-4 year old range by 2060.
Other economically established countries like those of China, Germany, and Japan will have populations that average in the older ages, whereas America’s population will remain relatively young due in part to heavy immigration flows.
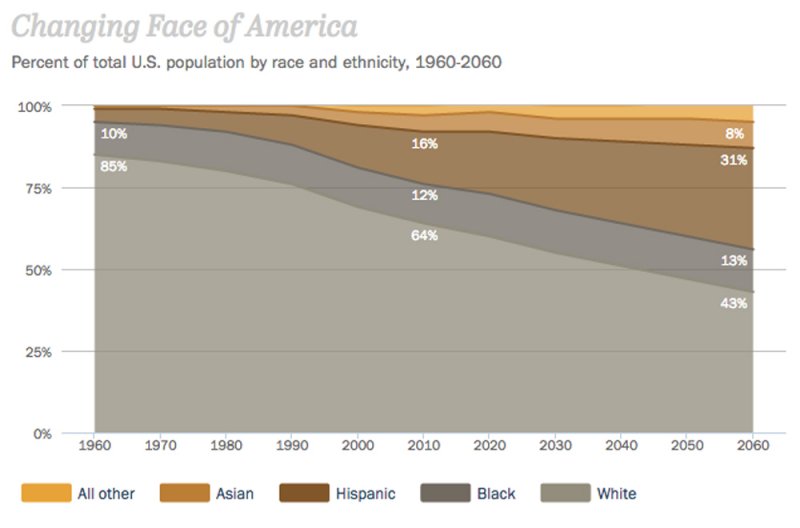
And it’s our still strong immigration practices that will drive our demographic makeover, according to Pew. This is not anything new. The country was built on the immense immigration of the 19th century. But what is new – as data showed – is that where in the early 1900s 9 in 10 immigrants were European, since 1980 50% are from Latin America. Social survey displays they are hard working optimists that tend to have several children which combined, will make up about 37% of our population by mid-century and rise.
As Pew puts it, America is “going grey” on the black and white scale, and population wise, is becoming a rainbow. Our intricate new racial tapestry is being woven by the more than 40 million immigrants who have arrived since 1965. And with this comes the expected rise of inter-racial marriage, with 1 in 6 couples now being inter-racial, at the rate of 15.5% of newlyweds. Which begs the question: Will racial categories even make much sense by 2050?
Enter the phrase “mixed race”. Pew’s data shows more than a quarter of Hispanic and Asian newlyweds “marry out” to other races, as do 1 in 6 blacks and 1 in 10 whites. Even though Whites seemingly marry out at lower rates, with the category still being the largest racial group, Whites make up 70% of inter-racial marriages.
This week National Geographic also went viral on the topic, with visuals of what we will look like in 2050.
If you’d like to know more about the project, all of the data and interactive charts are available here, which display even more fascinating topics, such as special interests, technology, and more.
-Curt Cramer (@CurtisRemarc)